How to Nudge a Chart in PowerPoint
Have you observed that you can’t nudge the charts on your slides using the up, down arrow keys, as you do for other objects? In this article we will see how to overcome the limitation with a simple workaround not known to most presenters.
A quick work about Nudging
‘Nudging’ is - moving an object by a slight measure. In PowerPoint 2013, when you select an object and click on up, down, left or right arrow keys, the object moves in the chosen direction by a pixel. This is extremely helpful to place your objects on the slide with precision. After all, you can’t move objects to their exact position by holding their handles.
Animation is not a cure for poor data presentation. You still need to get your basics right for the chart animation to have an impact. Some of the basics are shared in this infographic below.
A practical scenario for nudging a chart:
Let us say I create chart on the slide as follows:
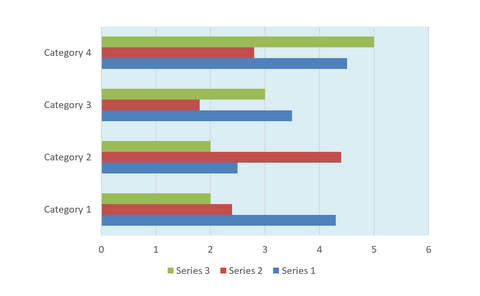
I want to place the chart on a background graphic that looks like this:

The end result of placing the chart on this background should be:
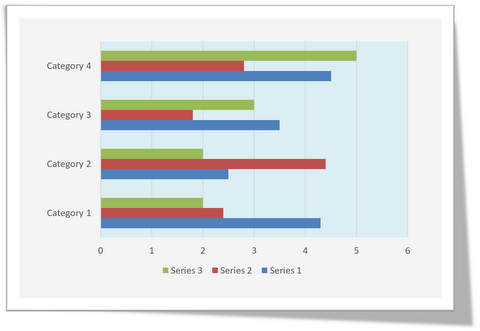
If you create a number of such backgrounds on a slide to create a dashboard, you can’t always nudge the background. You need to nudge the charts to fit them inside the backgrounds.
However, when you use arrow keys you would find that it only serves to select different elements inside a chart rather than to nudge the chart. What is the way out?
A simple trick to select the chart:
Instead of just clicking on the chart, hold the ‘Ctrl’ button when you click on the chart. This holds the chart in position. Now, when you click on the arrow keys you would observe that the chart moves the way you need.
You can use ‘Ctrl + Click’ trick to nudge any object with arrow keys.
Related: More control key shortcuts
Another way to impress your audience:
While charts are useful for data visualization, you need diagrams and graphics for concept visualization. If you are business presenter, you may not have the time to create high quality graphics and diagrams from scratch.
That is why we came up with our Visual PowerPoint Graphs Pack collection. The pack has 320+ editable charts. Just choose the template that suits your requirement and edit data. Your business slides get ready in no time. Creating professional quality business slides has never been easier.
Why waste time creating data-driven graphs from scratch when you have such a high quality solution available off the shelf?
Please note: The graphs pack is hosted and sold through our other site Presentation-Process.com. The contents of the pack are created completely inhouse by the same team that owns All PPT Templates.
We hope you found this article useful. If so, please share this article with your friends and leave your comments below
Related Posts
Top of Page : Nudge PowerPoint Charts
Main PowerPoint Tutorials Page


New! Comments
Leave me a comment in the box below.