PowerPoint Data Driven Charts
Part of 600+ PowerPoint Infographics Pack
Fully editable info graphics created in PowerPoint for making stunning business presentations, brochures, sales pitch etc. Get Now & Download instantly!
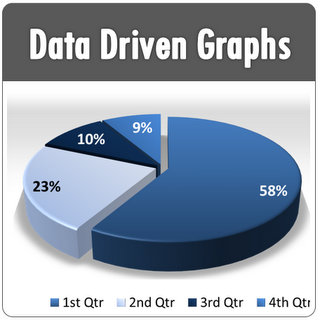 |
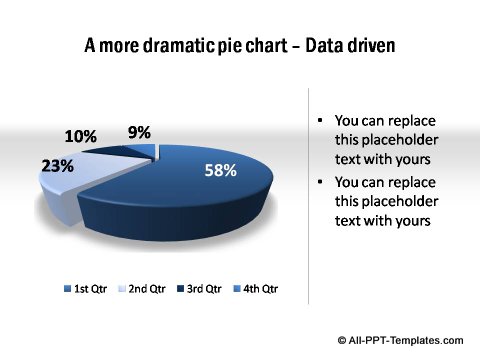
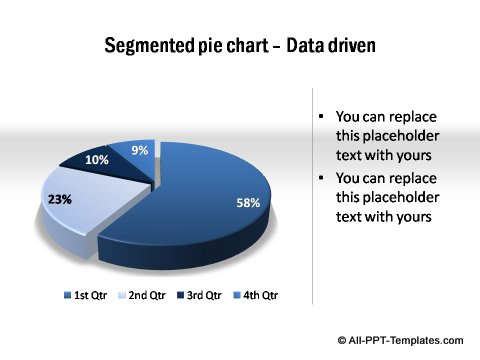
Find pre-formatted data-driven charts in this section. This includes commonly used business graphs like pie chart, line graph, trend lines, moving averages, bar chart, column chart, radar chart, area chart and bubble graph. All templates are fully editable using the in-built worksheet function in PowerPoint. |
Click on images below to view details
Pie Charts
3D Segmented Pie Chart
|
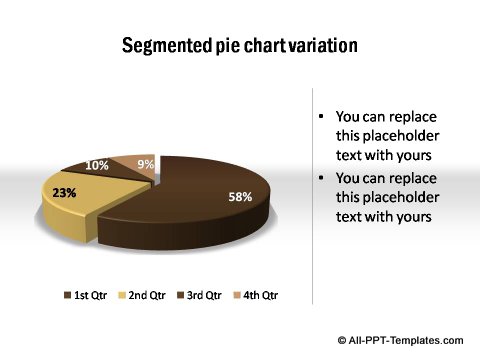
Segmented Pie Chart |
Segmented Pie Chart | |
|
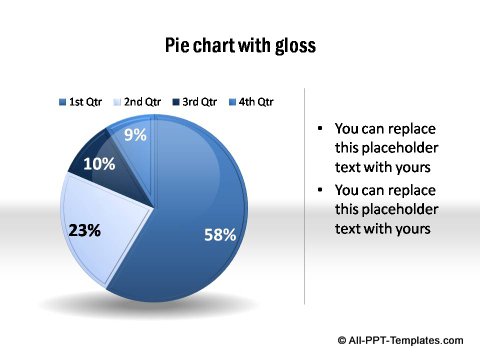
Pie Chart with gloss |
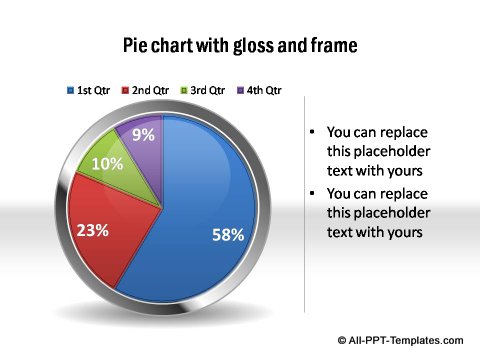
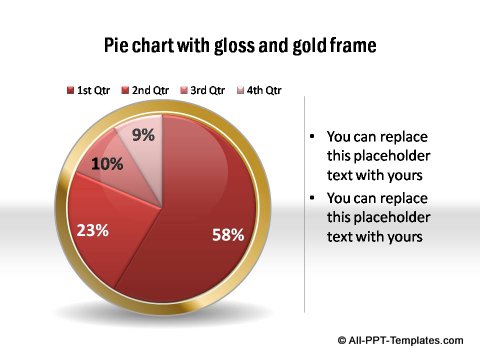
Pie Chart with frame | |
|
Pie Chart with frame |
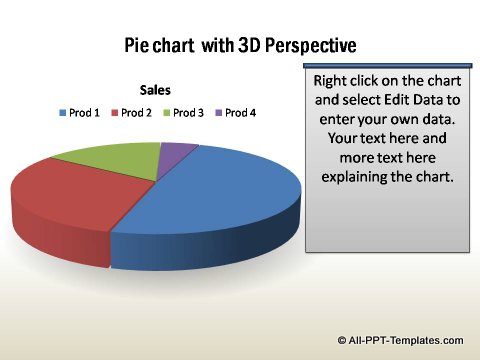
Pie Chart with 3D | |
|
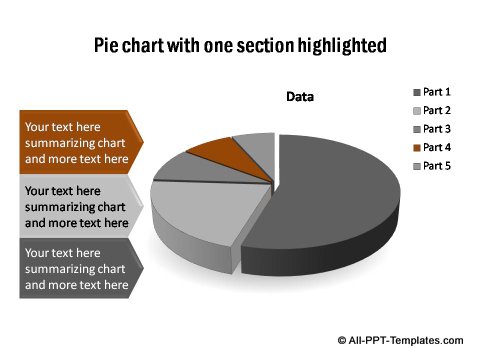
Pie Chart with highlight |
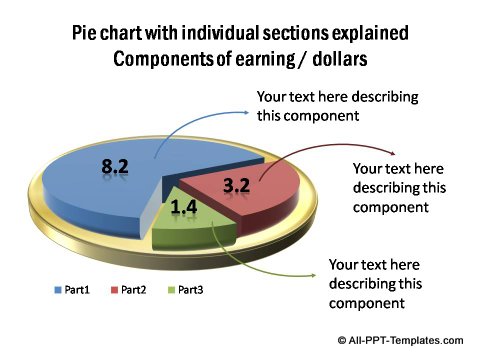
Pie Chart with details |
Column Charts
|
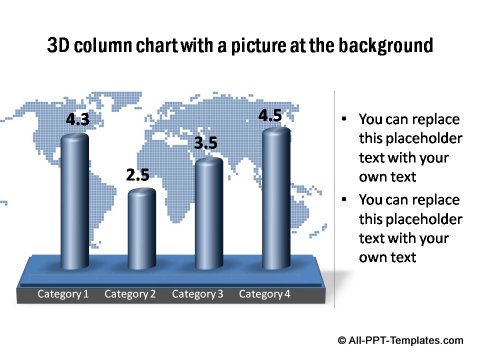
3D Column with Background |
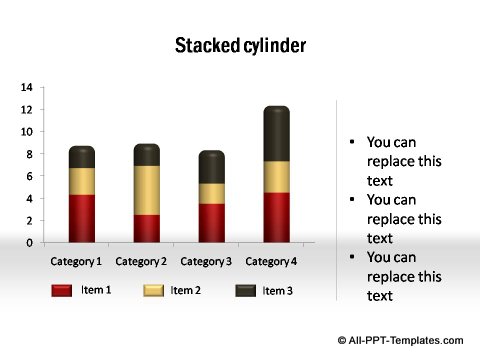
3D Stacked Cylinder | |
|
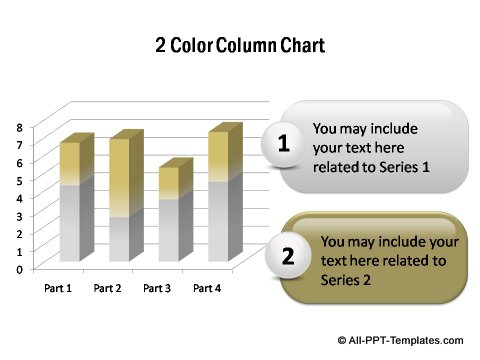
2 Color Column Chart |
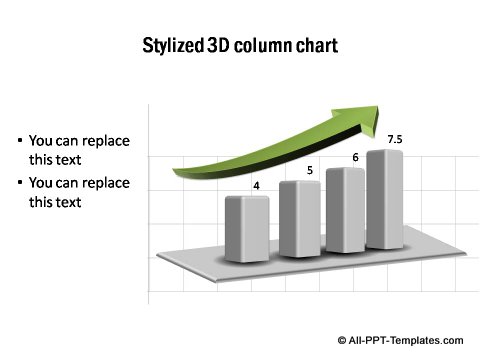
Stylized 3D Column chart | |
|
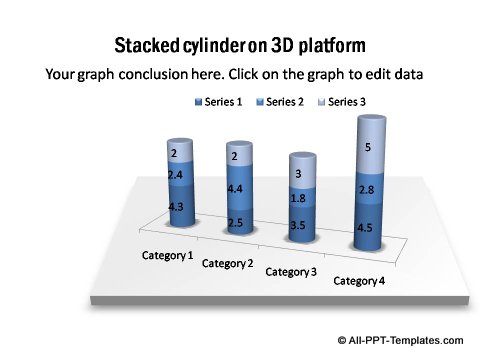
Stacked Cylinder on Platform |
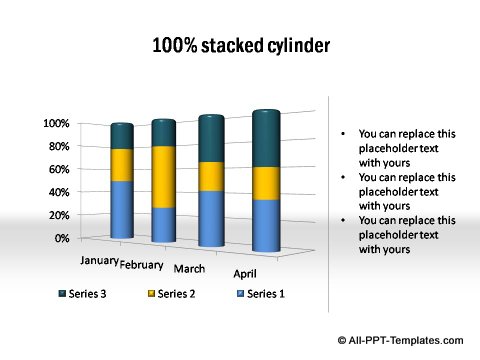
100% Stacked cylinder |
Bar Charts
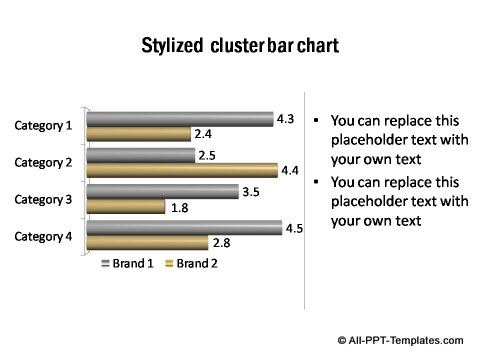
Stylized Cluster Bar Chart
Line Graphs
|
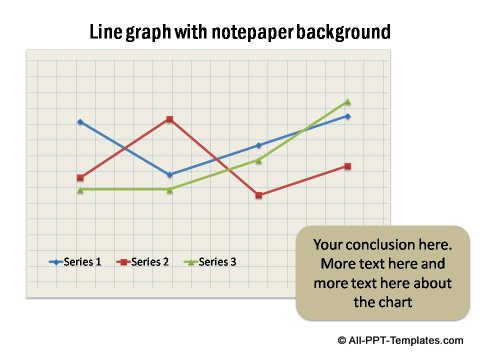
Line graph on notepaper |
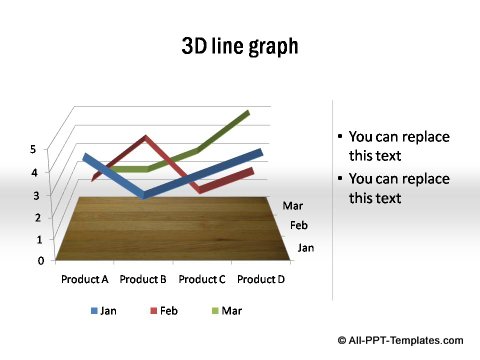
Line graph in 3D | |
|
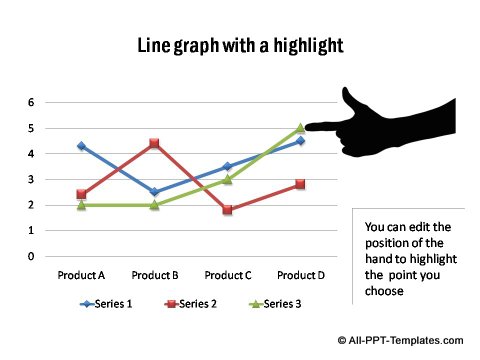
Line graph with highlight |
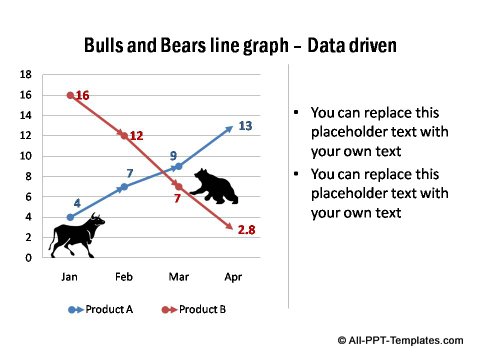
Bulls & Bears Icon Graph | |
|
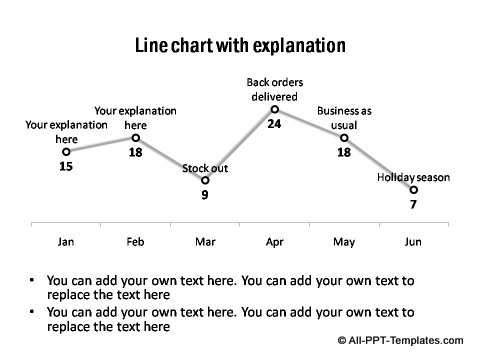
Line chart with explanations |
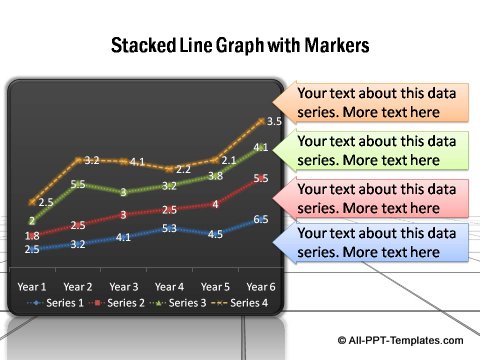
Line chart with markers | |
|
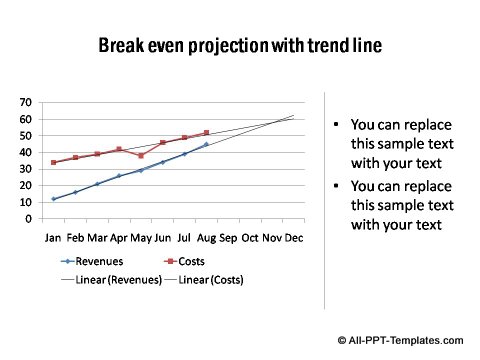
Breakeven projection with trend-line |
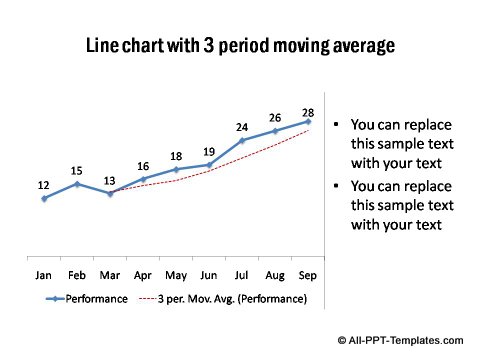
Line chart with 3 period moving average |
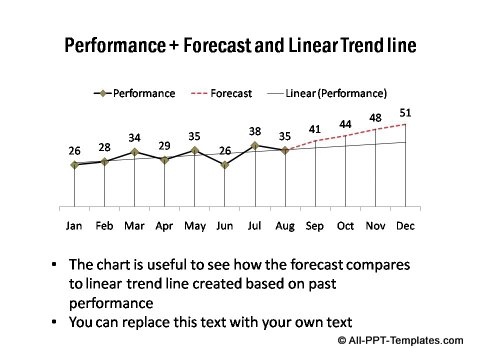
Performance forecast and linear trend line
Other Graphs
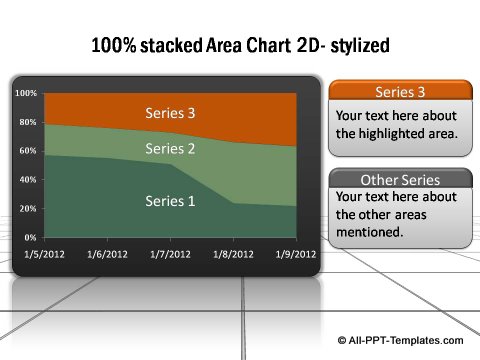
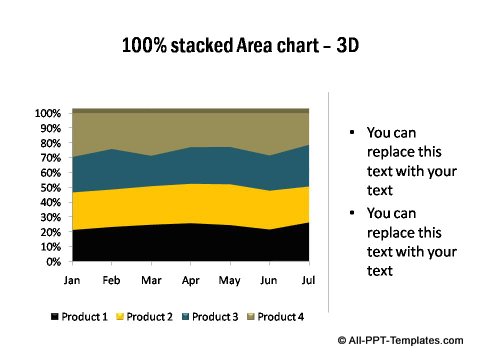
100% Stacked Area Chart
|
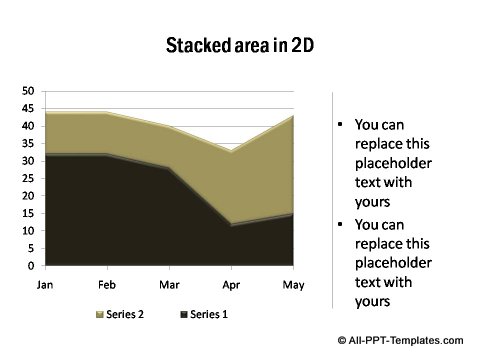
Stacked Area Chart in 2D |
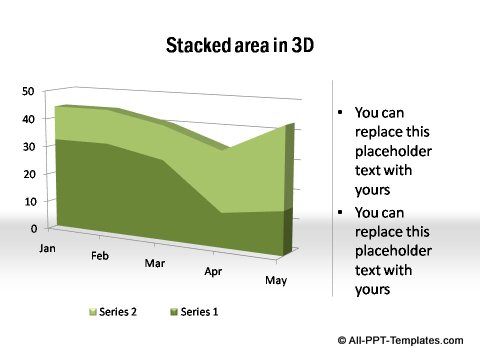
3D Stacked Area Chart | |
|
100% Stacked Area Chart |
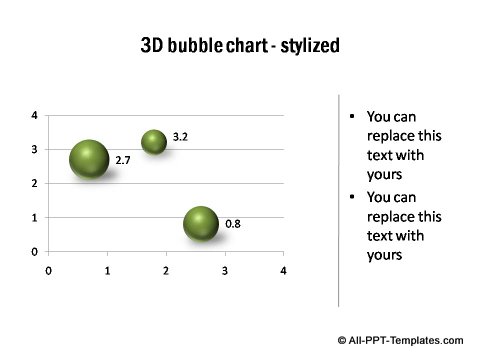
3D Bubble Chart | |
|
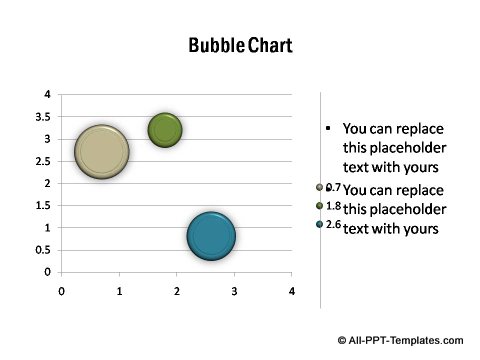
Bubble Chart with Bevel |
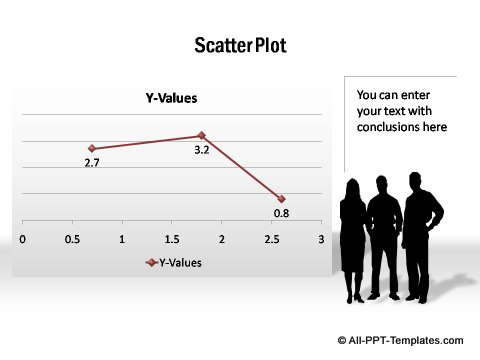
Scatter Plot | |
|
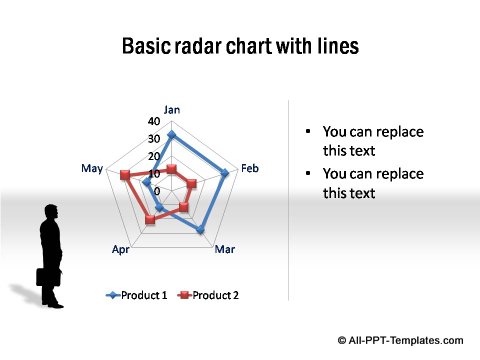
Radar Chart with lines |
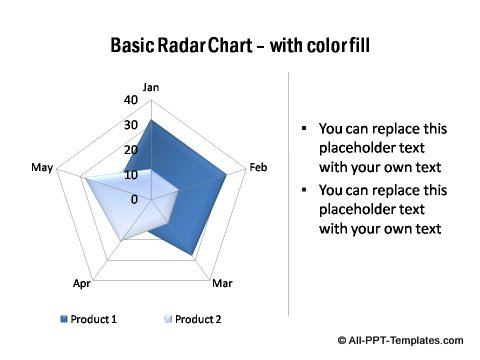
Radar Chart with color fill |
How to edit data-driven charts
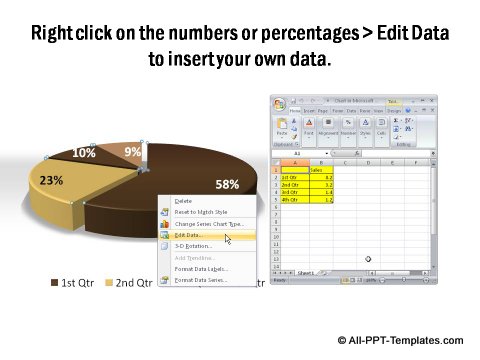
The screenshot at the top shows how easily the graphs in this set can be edited. The graphs work using the worksheet function in PowerPoint. Just Right click (Ctrl + click in Mac) on the graph, Edit Data and insert your own data.
- No additional software required.
- You can copy & paste data from Excel.
- Easily change colors, 3D effects etc.
Browse Related Graphics from Infographics Pack
Get 600+ fully editable infographics to make over your next presentation...
Return to Main PowerPoint Infographics Page
Return to Top of PowerPoint Data Driven Charts Page


New! Comments
Leave me a comment in the box below.