Understanding PowerPoint Material and Lighting effects
As part of our PowerPoint 3D tutorial series, learn how to use Material and Lighting effects when you create a 3D object. Using these effects can make your 3D objects stand out clearly.
PowerPoint allows you to choose a variety of surface materials to make your 3D shapes look more attractive. You can light up your shapes to make them come alive. The options are part of 3D Format pane.
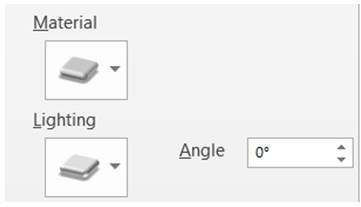
By default the option set for Material and Lighting are ‘Warm Matte’ for Material and ‘Three Point’ for Lighting:
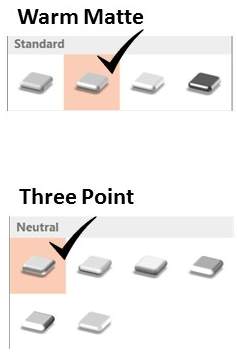
You can vary the Material and Lighting options to suit your specific needs. For that you need to understand the impact of the various options on your 3D shapes. In this article, we will understand the options a little better.
PowerPoint Material Option:
The ‘Material’ option determines the sheen, texture and brightness of surface of a shape.
There are three types of settings available for Material. They are
- Standard,
- Special Effect and
- Translucent.
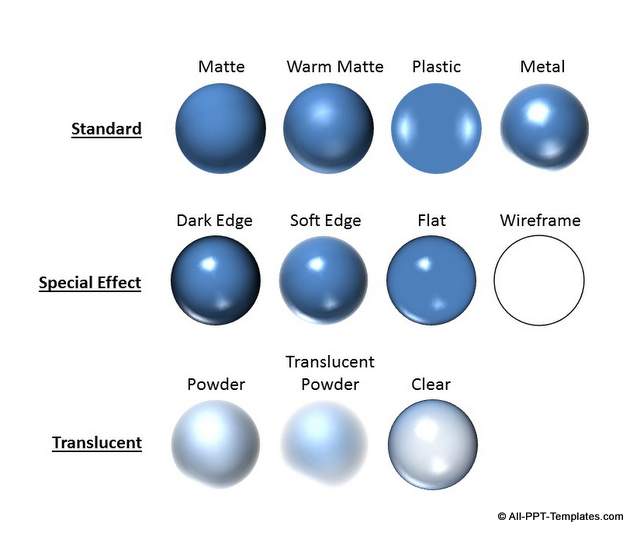
There are a number of options within each of those settings. We would be able to understand the impact of these options when we apply the effects on a 3D sphere as shown below:
Based on our personal experience, we can divide the material effects into the following ways:
- Soft & Professional – Matte and Warm
Matte. If you want your 3D shapes to look professional and understated use Warm
Matte as your Material choice.
- Plastic like feel with increasing intensity
– Plastic < Metal < Dark Edge < Soft Edge < Flat. Using these
options for material makes your 3D shapes stand out. Apply these effects only
when you want to draw your audience attention to your 3D shapes
- Wireframe - You can create some interesting vector designs with this option. Otherwise, it is not a Material option you would choose normally.
Glass like effect with increasing transparency – Powder < Translucent Powder < Clear. Use it to create effects like transparent bubble. These options have specific purpose on a slide and can’t be used regularly.
It is a good idea to stick to the same material effect for all the objects on a slide, unless you want a specific shape to stand out by using a different effect.
Lighting Options in PowerPoint:
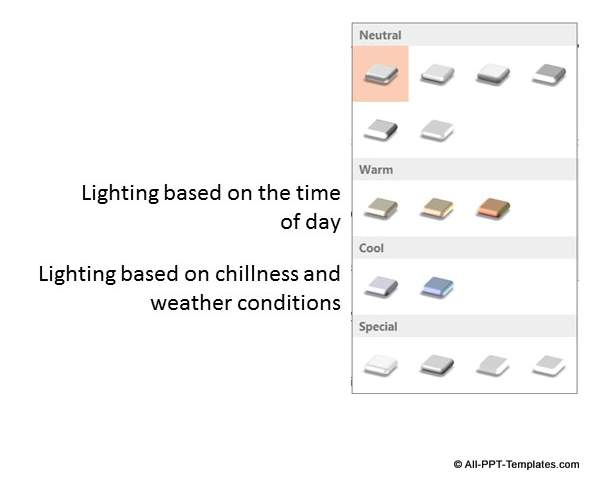
Here are the different type of ‘Lighting’ options available in PowerPoint:
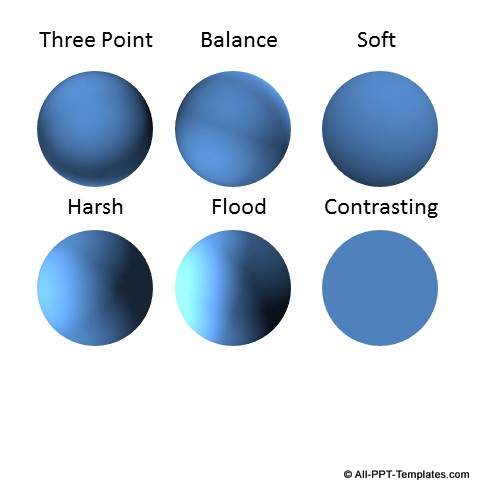
We create professional PowerPoint templates for living. We made tens of thousands of graphics and diagrams till date. But, we never found use for any lighting options other than the set under ‘Neutral’. Here is how the diagrams would look with different types of neutral lighting:
Here is our view on the other set of lighting options:
- Warm – These lighting options are based on the time of day. The three choices are Morning, Sunrise and Sunset
- Cool – These lighting options are Chilly and Freezing
- Special - Flat, Two Point, Glow and Bright Room
We really don’t know why someone would
choose the lighting for their 3D shapes in a business presentation based on the
time of day or weather conditions. So, ‘Warm’ and ‘Cool’ are not even in the
consideration set. We find ‘Special’ lighting to be too bright. So when you
apply the lighting, you draw undue attention to the shapes and distract the
audience.
Arriving at a Professional 3D look:
In terms of Material – choose between Warm Matte and Dark Edge depending on whether you want the material to be subtle or loud.
Once you choose the material – Click on the various options under ‘Neutral’ to decide on how much lighting you need. The brightness in lighting increases in the options from left to right.
Once you like a combination, stick to it for the rest of your presentation. Trust that helps you choose the Material and Lighting options in PowerPoint.
Quick Help Guide Infographic for 3D options in PowerPoint
To make it easy for you to find which 3D option to use when you are creating a 3D diagram in PowerPoint, we'd like to share this useful infographic. It summarizes the contents of the article you have just read and provides a quick reference guide. Just right click on the infographic and Save Image As... to save the helpful guide to your desktop.
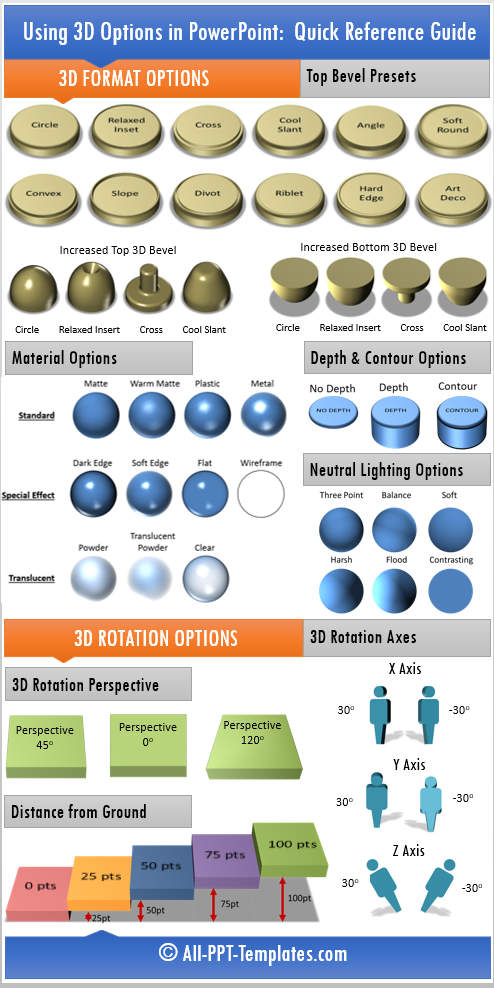
Here are some creative examples of how 3D material and lighting can be used and integrated into a diagram seamlessly :
Examples of using Material and Lighting in Diagrams
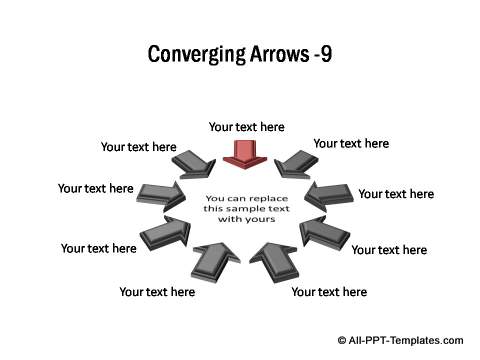
1. 3D converging arrows
In the following diagram we have applied Dark Edge Material effect and 10% lighting.
Source: All Inclusive Charts Pack : Converging arrows
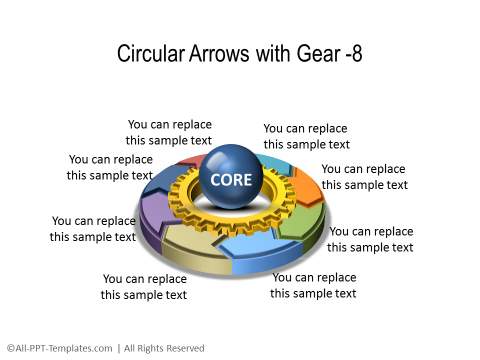
2. Formatting options applied to 3D Core diagram
The following 3D core diagram with circular arrows has a Warm Matte Material effect applied:
Source: 3D Core Diagram from All Inclusive charts pack
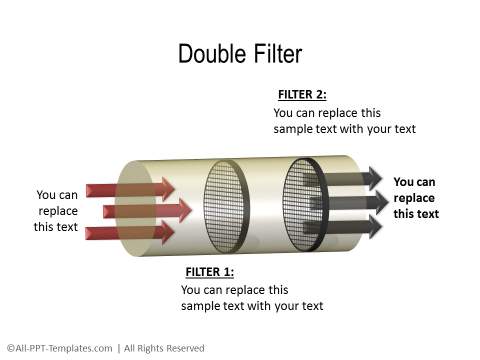
3. Filter with a transparent effect
Usually you'd expect transparent effect to be created with transparency option. See how we have used the Material settings and lighting to create a transparent effect in the diagram below:
Source: PowerPoint Filter diagram from All Inclusive charts Pack
These are some of the examples of diagrams you can create using PowerPoint Material and lighting options.
We hope you found the tutorial and examples useful and can apply the learning to your next presentation.
Another way to impress your audience:
Using the right material and lighting is one way to make impressive slides. Another way to impress the audience is to use high quality charts, graphics and diagrams on your slides.
However, it takes a lot of time and effort to create high quality graphics and diagrams from scratch. As a busy business presenter, you may not be able to spend the time needed to build and polish your diagrams every time you make a presentation.
That is why we came up with our All Inclusive PowerPoint charts collection. All the templates in the pack are 100% editable. Just choose the template that matches your thought and replace the sample text with your own text. Your business slides get ready in no time.
Why waste time creating your graphics and diagrams from scratch, when you have such a high quality solution available off the shelf? Please browse through our diagrams collection and see how the templates can change the way you create your business presentations forever.
Related Posts
Top of Page : PowerPoint Material
Main PowerPoint Tutorials Page
